
A Refresher on the March Toward Social Security Insolvency - AMAC Foundation

The published projections vary a bit. The most recent Social Security Trustees Report sets 2033 as the year when trust fund reserves will be fully depleted, but the Committee for a Responsible Federal Budget (CRFB) sees late 2032 as the point of exhaustion. Projections on the across-the-board impact of reaching this point also vary, with the Trustees Report suggesting a 23% cut and CRFB calling it at 24%.
Defining the Problem
When the trust fund reserves are fully depleted, Social Security benefits will be forced to move to a cash basis, where benefits paid must equal revenues received. The reality of this situation sets program beneficiaries up for severe consequences in about seven years. As noted earlier, this shift to cash in/cash out is projected to result in a substantial across-the-board cut in benefits that will grow as more retirees enter the program.
This is not the first time insolvency has surfaced in the program’s history. With the remedial action taken in the early 1980s, it was projected the trust fund would remain solvent for 75 years; unfortunately, changing demographics have rendered this projection obsolete, with the point of full cash reserve depletion now projected to be reached some 25 years sooner.
A Quick Recap of How We Got Here
Depletion of Social Security’s trust fund cash reserves can be attributed to several key factors, beginning with the length of time benefits need to be paid to beneficiaries. For example, since 1940 life expectancy for those reaching age 65 has grown substantially, increasing by 9.7% for females and 8.5% for males, a trend expected to continue increasing through the end of the century.
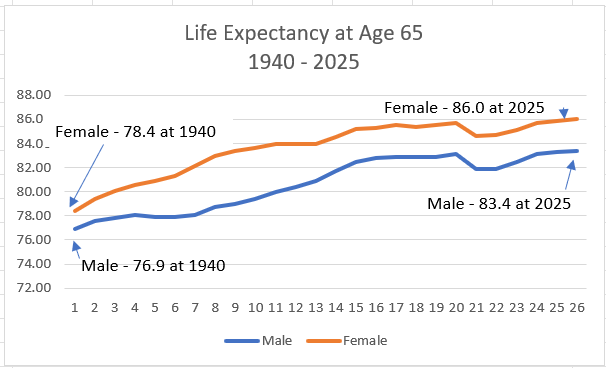
Source – https://www.ssa.gov/OACT/tr/2025/V_A_demo.html#226697
The fact that American seniors are living longer is indeed a positive societal development, but it presents a challenge to ensuring long-term Social Security solvency. In addition to longer life expectancy, the “Baby Boomer” generation has been reaching retirement eligibility since 2008. This population cohort is unusually large—76 million—and is expected to nearly double the number of Americans over age 65 by 2031.[1] With many baby boomers claiming benefits early and many of them leaving the workforce entirely, it is expected that there will be additional pressure on Social Security’s cash flow as the growth in the number of beneficiaries increases at a faster pace than the number of workers contributing to the program. On this point, the taxpayer-to-beneficiary ratio has dropped dramatically, skidding from 42:1 in 1945 to less than 3:1 today, with projections indicating a continued decline in the years ahead.[2] Further, the most recent annual Social Security Trustees’ report noted, “There were about 2.7 workers for every OASDI beneficiary in 2024.”[3]
Another factor relates to the size of the future taxpaying workforce. The CDC reports that the 2020 U.S. birthrate fell by 4% from 2019 and, after a slight uptick in 2021, again dropped in 2022 and 2023, marking a return to a pattern of declining births. This tends to presage the expected decline in the taxpayer-to-beneficiary ratio,[4] as does the 3% increase in the U.S. infant mortality rate reported by the National Center for Health Statistics in 2023. [5] As a result, Social Security is projected to see a continuing decline in the number of taxpayers, exacerbating the program’s current and future deficit projections[6].
In addition to the above drivers, Steven C. Goss, Social Security’s former Chief Actuary, has cited an even more significant factor in the projected trust fund depletion. Specifically, Goss suggested that the phenomenon of “earnings dispersion” has created a situation where an unexpected amount of earnings is escaping payroll taxation due to an increased number of higher earners exceeding the annual taxable maximum. He reports the results of a study showing that the ratio of total payroll to taxable earnings has dropped from a projected level of 90% to 82.5%, with real wage growth for the top 6% earners outstripping the wage growth of the lower 94% by 45%. The effect on projected Social Security finances is dramatic, with 7.5% of a total payroll of roughly $13 to $15 trillion essentially escaping the 12.4% payroll tax. Goss further projects that the lower taxable ratio will continue in the years ahead, further aggravating Social Security’s financial situation. Full coverage of Goss’ remarks can be viewed here.
Will the problem be Fixed?
Despite the potential for catastrophe, Congress can restore Social Security Solvency if lawmakers act swiftly, much like they did with the 1983 Amendments. It is imperative that corrective action be undertaken as far in advance of full trust fund depletion as possible to minimize disruption. While immediate action is critical, so too is adopting the best long-term solution.
The Social Security Administration has evaluated hundreds of proposals in recent years, and a steady stream of ideas has emerged to modify the program for the 21st-century economy. It’s anybody’s guess on the timeline for congressional action, but most analysts understand that this is not a self-correcting problem and action is needed sooner rather than later.
The link provided above connects readers to the full content of the posted article. The URL (Internet address) for this link is valid on the posted date; socialsecurityreport.org cannot guarantee the duration of the link’s validity. Also, the opinions expressed in these postings are the viewpoints of the original source and are not explicitly endorsed by AMAC, Inc.; the AMAC Foundation, Inc.; or socialsecurityreport.org.
[1] National Academy of Social Insurance, How Will Boomers Affect Social Security?, https://www.nasi.org/learn/social-security/how-will-boomers-affect-social-security/.
[2] Mercatus Center, How Many Workers Support One Social Security Retiree?, https://www.mercatus.org/sites/default/files/worker-per-beneficiary-chart-jpeg.jpg.
[3] https://www.ssa.gov/OACT/tr/2025/II_D_project.html#132991
[4] Center for Disease Control, Vital Statistics Rapid Release, https://www.cdc.gov/nchs/data/nvsr/nvsr74/nvsr74-1.pdf
[5] https://blogs.cdc.gov/nchs/2023/11/01/7479/#:~:text=A%20new%20Vital%20Statistics%20Rapid,rate%20since%202001%20to%202002.
[6] U.S. Bureau of Labor Statistics, Employment Projections Civilian labor force participation rate by age, sex, race, and ethnicity – https://www.bls.gov/emp/tables/civilian-labor-force-participation-rate.htm.